Here’s a Graphic Design and Content Writing tip that you can use as a niche blogger to generate longer session time – if you have multiple blog posts demonstrating data, this can be ‘link juice’ gold.
I just finished reading some interesting insights in an article from NP Digital (as usual) this morning and wanted to share this with you in a quick micro blog post.
Blogging basics: It’s perfectly acceptable to create micro blog posts for your niche blog – not all blog articles have to be long-form for the sake of SEO.
Infographics increase engagement (sessions) compared to traditional photo imagery, even if it’s conceptual photography… you know, the kind that makes you think.
A factually detailed graphic can make a user stay in your blog post longer
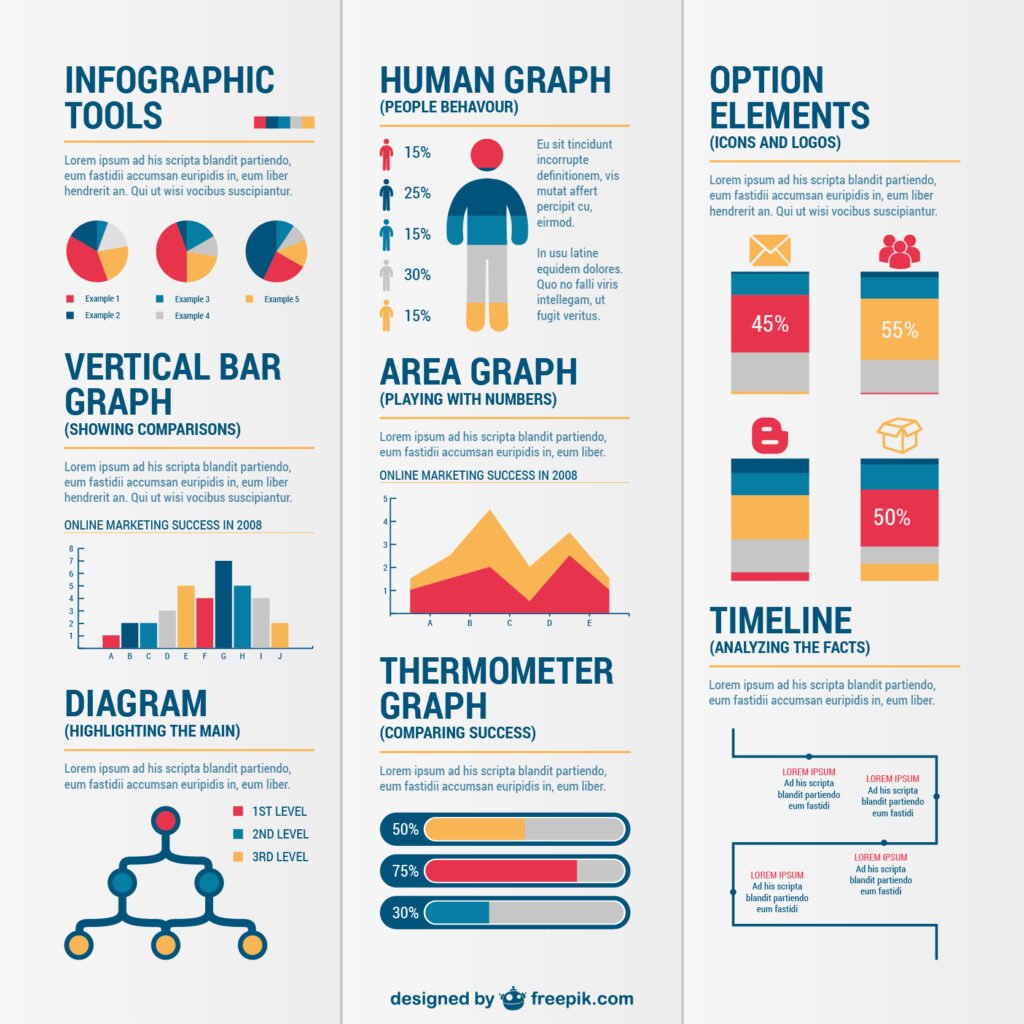
His post promotes the engagement benefits of infographics as opposed to using traditional photo imagery in blog posts and articles.
Yes, illustrated graphics are always eye-catching, but here’s my take – those factual details and comparisons are genuinely thought-provoking, and that’s what makes the user hover on the infographic a lot longer than when analyzing a photo image.
You’d think a user stops to check it out because it’s colorful and intriguing – thanks to either good or poor design.
When actually, it’s the thought-provoking nature of the experience. The info in the graphic makes the cogs turn.
The user most likely stopped to read more of it because he/she/they saw something that’s memorable, resonant or familiar.
In other words, there’s something to contemplate, especially when the user starts to subconsciously relate it to their own experience.
Whether for project or personal purposes, the info starts to become meaningful.
Even when it’s a tiny, simple stat.
You can’t deny, that infographics are always interesting, no matter how good or poor the layout – of course, as content creators, we always aim to produce high-quality visual content or our users will simply navigate away to another niche blog.
So, the more meaningful the info, the longer the user stays to contemplate that information.
The longer the user hovers, the longer the session, and that’s all good for the session (traffic) stats overall.
Beginner bloggers: This is why it’s good to learn Google Analytics to analyze sessions – this is what it’s there for.
You’re not just analyzing how many footsteps are coming through the shop door. You also want to find out the following:
- how many visits a user is doing
- how long their visits are
- as well as which aisle they’re spending the most time in.
In other words, what’s piquing their interest? Because what’s peaking their interest is usually based on something they’re looking for.
- How to Start a Blog Without Using Social Media
- Simple Blog Ideas for People Who Feel Like They Know Nothing
- How to Choose a Blog Niche When You Have Too Many Ideas
- Micro niche – How to validate one in 2026
- Stovetop meals – 10 easy and affordable recipes with ingredient lists
As a content writer, creator, or blogger, that’s what you should be constantly obsessed with – what do users/readers want or what are they looking for, for whatever reason?
For clarity and to reduce beginner blogger overwhelm, here’s a two-step approach:
- Know what they want first, that’s enough to digest.
- Then collect more data about your user and analyse that to understand why they’re looking for it.
Why graphic designers or digital publishing designers should find gold in this
For me, it’s an excuse to maximize my recent conversion to (and purchase of) Procreate from Adobe Fresco (albeit Beta).
If you have Procreate – buying it for your iPad is worth the investment – you can use it as a data visualization tool and create engaging infographics for your articles.
If you’re a graphic designer and blogger, like me, you can use this as a way of building out your digital illustration or layout design portfolio.
Either way, data visualization (infographics) can be visually stunning as well as thoughtful content for your niche site and you should take of advantage of it if you want to generate longer session time.
I’ll be writing an article soon about data visualization using Procreate and where to find free data sets.
Sign up below for updates so you don’t miss that one.
In the meantime, check out this inspirational tutorial on their website.
Conclusion
If you liked this post, leave a comment, I value all feedback.
Read this post for more content creation inspiration.
Remember to join the newsletter below.
Disclosure: While this publication uses AI tools for data collection and analysis support, the research questions, hypotheses, and core insights are the human author’s original work. AI assists with information processing, but all conceptual thinking, interpretation, and conclusions reflect the human editor’s and human writer’s professional expertise.
